Instagram Statistics and Analysis: How to View Data of any Account

It is impossible to work efficiently without analyzing the result. We delve into how to monitor Instagram statistics, what indicators can be found, how to monitor the account’s growth, how to compare multiple accounts and get detailed data of competitor’s pages.
How Instagram Statistics Can Be Useful?
For an Instagram account we can get: count of followers, count of likes, count of comments, count of video views, profile’s reach, profile’s count of views, count of story views.
Using those figures, we can calculate other indicators: account growth rate, average counts of likes and comments, engagement rate (ER). These indicators allow comparison between different accounts. This is useful when you buy advertising from a blogger or want to assess what kind of content users like more – such posts have higher ER, i.e. more likes and comments. This value will be helpful for content strategy development: you will create more attractive materials for the audience.
Monitoring of Instagram statistics allows assessing how adequate is what you are doing. For example, you sell bags. Previously you posted photos of bags in the show room, shot by professional who installed lighting and processed the pictures for a long time. But you doubt that people find it interesting to see pictures of bags on white background. And you decide to post more photos with girls carrying your bag in the street or sitting in a café — that is to show how your product looks in real life. You think this is a good idea but the photographer disagrees. Statistical analysis would decide the controversy: you post pictures of girls with bags during a week and then evaluate the results for this week and the previous one.
Instagram account analysis will help evaluating the efficiency of an advertising campaign or the performance of a new specialist if you delegate advertising settings and bloggers relations.
How to View Statistics on Instagram
There are two convenient ways to see Instagram account statistics:
- Statistics on Instagram (for your own accounts);
- Using popsters.com social media analysis tool (for your own and others’ pages).
You can view Instagram account statistics in the app itself. The functionality is available for users who switched to business account. Anyone can do that.
To switch to business account (and enable viewing of page statistics on Instagram), Tap Settings and privacy, find menu item “Account type and tools”, then “Switch to professional account”. Follow the instructions by Facebook: create a business page in the Social media (it may be left blank) and fill in the contact details.
Account statistics on Instagram will be available for posts made after the business account was enabled. If you disable the business account and then enable again, all data will be lost.
What Data Are Shown by Instagram Statistics
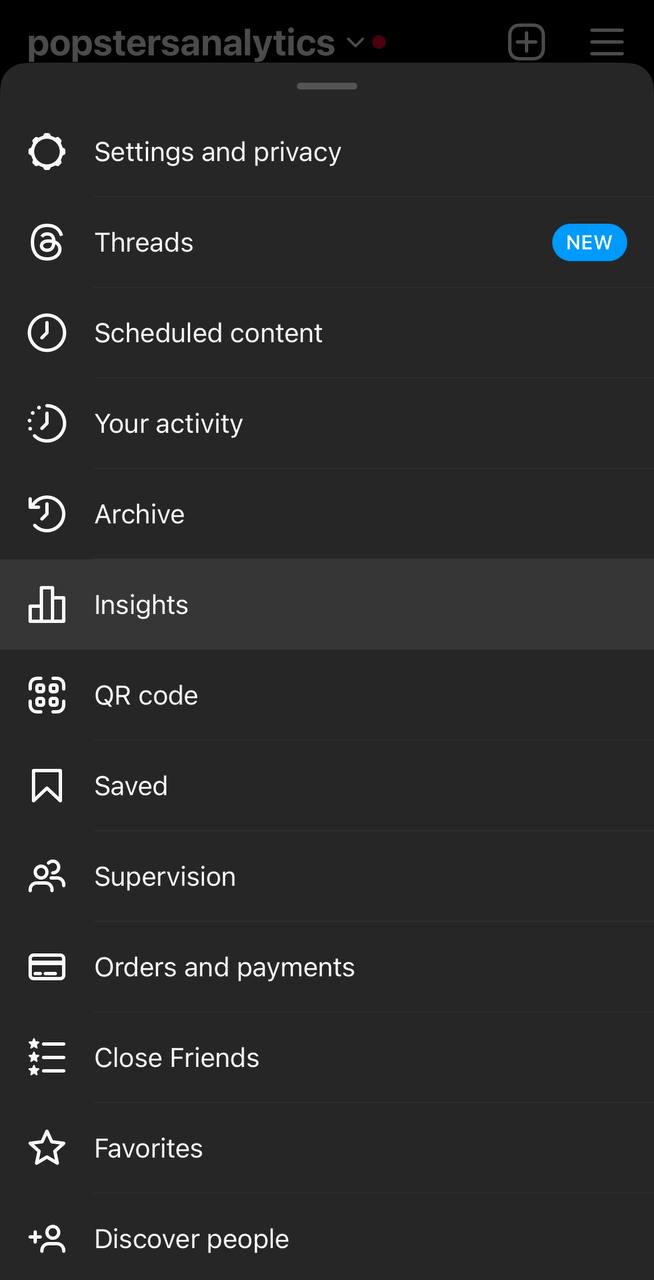
Click on the three bars in the top right corner of the profile and select "Insights".
Note that for promoted posts Instagram shows the total for the reach and sums of comments and likes, gained both naturally and by means of paid promotion. You will see two sections in the statistics: Promotion and Natural.
For detailed analysis, use the Instagram Insights tool. To navigate to it, select the statistics icon in the profile’s upper right corner.
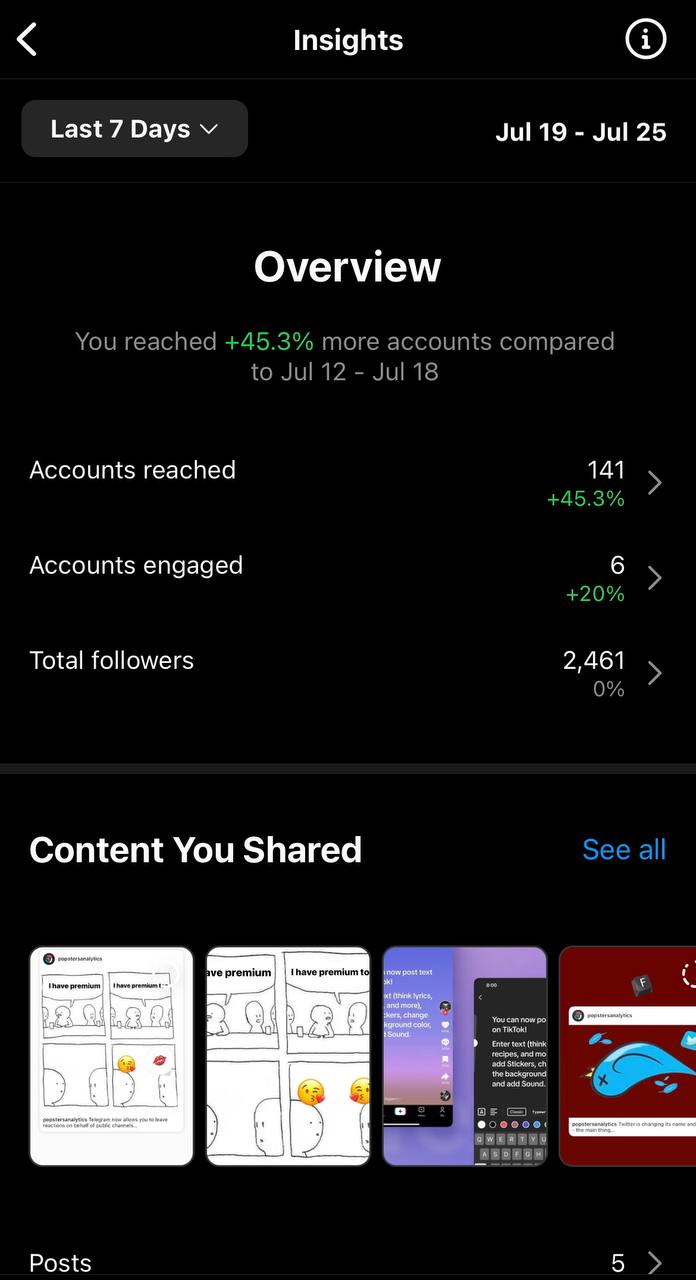
Metrics Shown by Instagram:
Views: Weekly total count of non-unique views for all your posts.
Reach: Count of unique profile views.
Profile Views: Count of non-unique profile views.
Website Link Clicks: Clicks on the link shown in the profile.
Send Email Clicks: Clicks on Contact button.
The Posts section gathers data for all the posts made since business account was enabled. Posts may be sorted by format (photo/video/gallery), time period (week/month/year/two years) and the following metrics:
Views: Non-unique post views.
Reach: Unique post views, 1 account gives 1 view.
Engagement: Engagement (summed likes and comments) count.
Likes: Count of likes.
Comments: Count of comments.
Saves: Count of saves.
These data will allow understanding which posts turned out to be the most discussed, popular and saved for the reporting period.
Stories
Although stories are deleted in 24 hours, the statistics stores data for 14 days.
You can sort the stories by views, reach, back and forward touches, exits from stories and replies to stories.
Live Streams
Live streams may be assessed by two parameters:
Viewers for a particular point in time: The streamer and all the viewers see the audience count in the stream’s upper right corner. It shows how many people watch the stream right now.
Viewers: this data become available when the streaming is over and to the streamer only. It shows the total number of accounts who connected to your stream.
Followers Activity and Demography
The next block of Instagram stats (summary) is users’ gender, age and location data, as well as followers’ activity during the week and by hour.
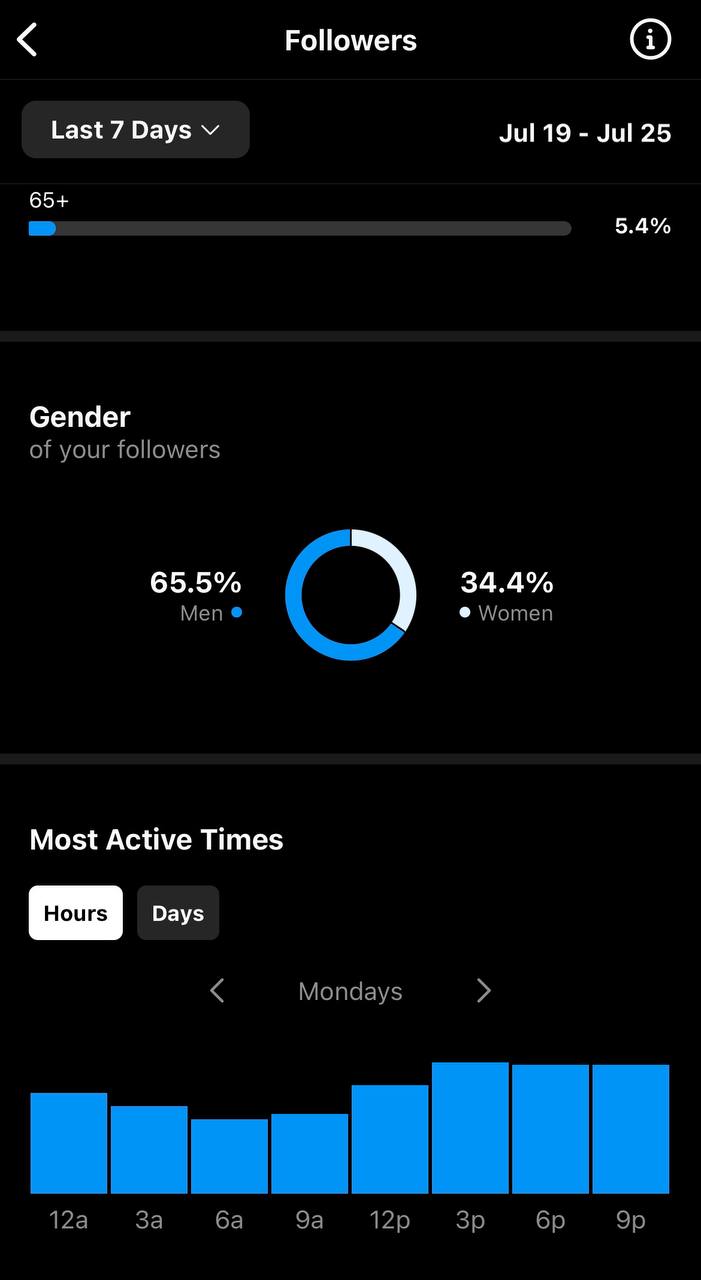
The follower's data are only shown for accounts with more than 100 followers.
The activity data show when your audience uses Instagram. This is the best time to publish posts – more people will see them. Instagram newsfeed algorithms take into account the engagement received by the post during the first minutes after being published. If your post is noticed and immediately liked, it will reach farther.
The data provided by Instagram are not enough to generate reports. For example, you cannot view account growth dynamics. And to make a detailed report, you would have to tabulate the data manually.
You can view only your own account’s statistics, which is why the Instagram’s internal statistics does not allow analyzing competitors. Therefore, if you are wondering how to view Instagram statistics for any profile, you need to use analytics tools. To analyze statistics in detail, download a report or obtain competitor’s data, use Popsters.
What Popsters Can Do to Analyze Instagram Statistics
The tool analyzes any account. You can load your company’s or competitor’s account.
Social analytics tool Popsters determines successful posts over the specified period: by counts of likes/comments, or ER.
You can find the most discussed posts – they have the highest number of comments. These are often contest posts. Tip: This analytic tool allows you to spot the competitors’ contest mechanics or ways to increase engagement in an account, as well as to find interesting contest subjects, which are likely to evoke response from your audience.
What Instagram account statistics Is Gathered by Popsters?
- Activity by week day or hour;
- Relative activity by text volume and week day or hour;
- Activity as a function of content type shows which format is more attractive for users, photo or video;
- Plotting diagrams for likes, comments, followers, ER;
- Count of posts by content type;
- ER as a function of post’s content type and text length;
- Text references: The tool finds posts that are most frequently used in the account, and also ER for posts containing a specific word.
The data can be analyzed at the tool’s page itself or exported to Excel, PDF or PPTX.
You can also download all the posts for the analyzed period.
Using Popsters to Analyze an Instagram Account
Sign in the tool with Instagram. Type the address of the desired account in the search bar, identify the time period you are interested in and click "Search".
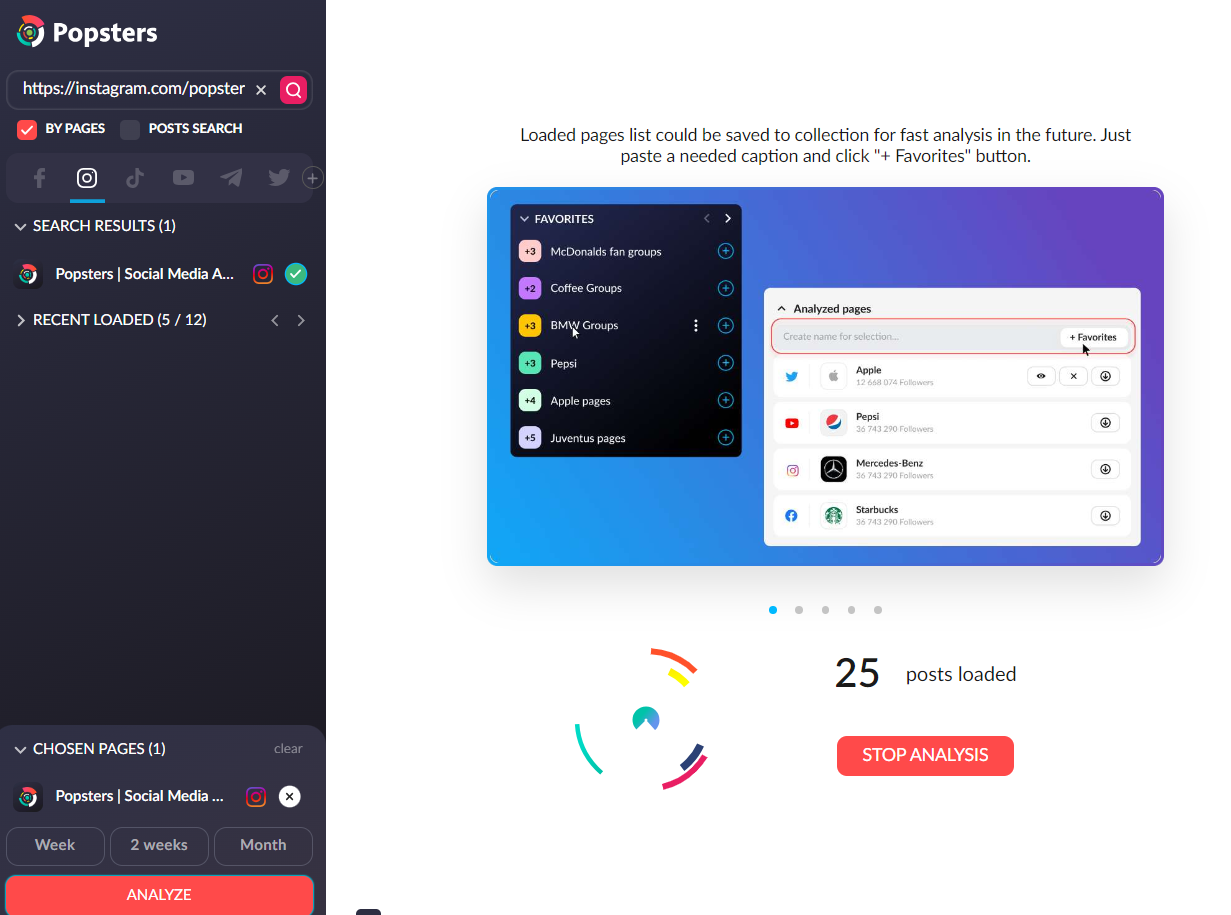
To compare two accounts, click “+” after adding the first one and then add the required page.
Instagram Account Statistics in Diagrams and Metrics
Let’s look at the diagrams and into what those data mean. To view diagrams for your account, select the required data in the left column Statistics.
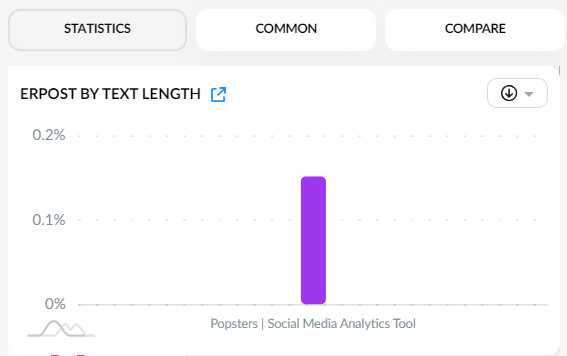
Text Length Diagram
Shows the engagement rate of posts with different length of the text
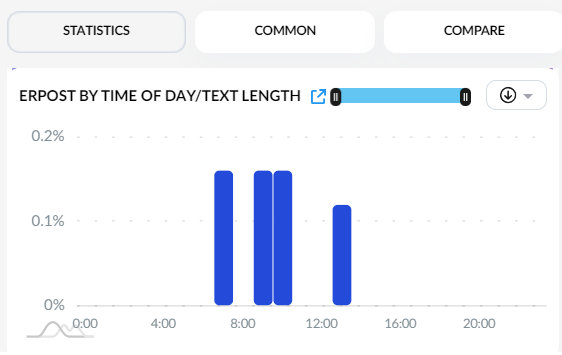
Hours Diagram
Reflects the success percentage of a post made on a specific time as compared to all the posts for the entire period.
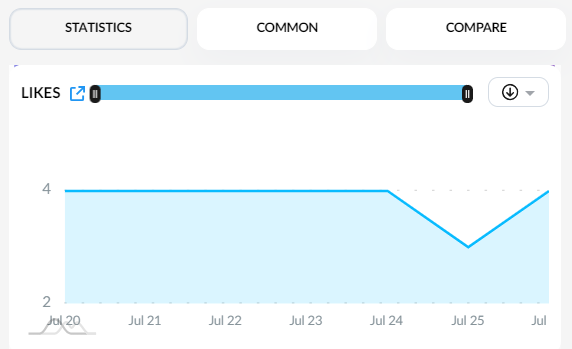
Likes Diagram
Shows the number of likes received by the account during specific days of the analyzed period. This Instagram statistics well known and stand out from the rest. But then you will see even more important metrics.
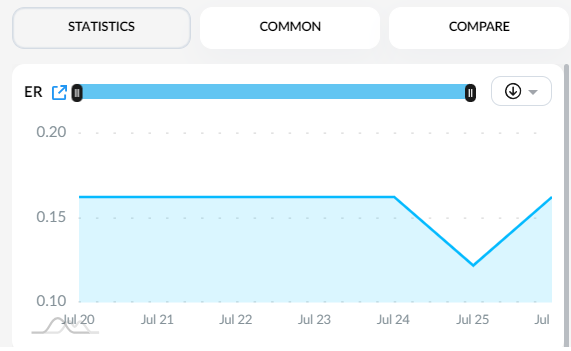
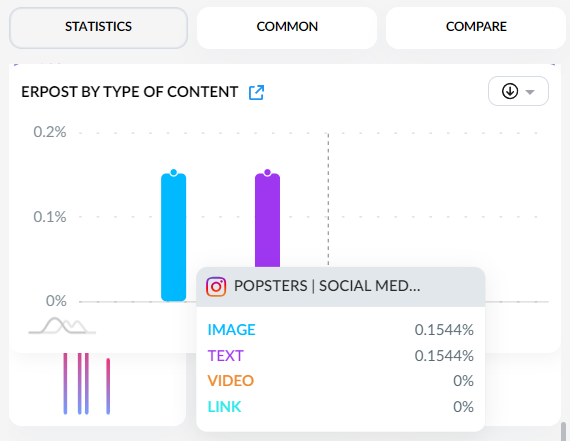
ER and Content Type
This is very useful stats for Instagram: statistics by total Er (engagement rate) for published posts.
Engagement Rate of posts depending on the type of attachment.
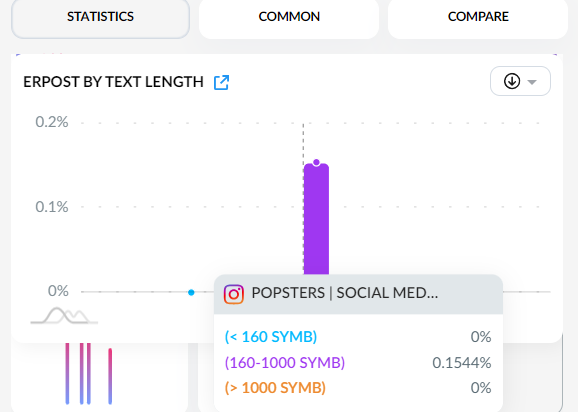
Engagement Rate of posts depending on length of text in the post.
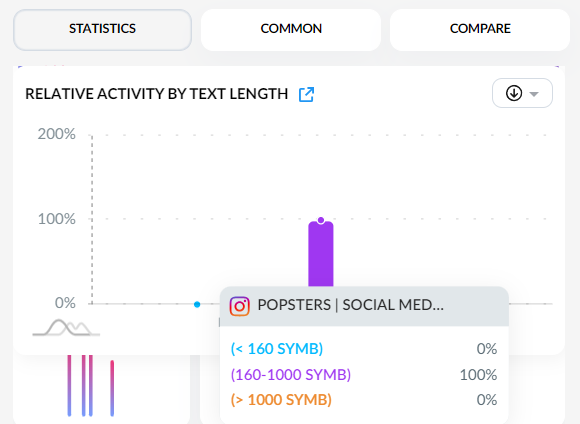
Competitive (relative) activity depending on length of text in the post.
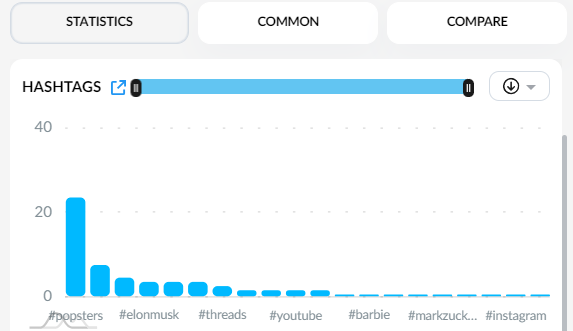
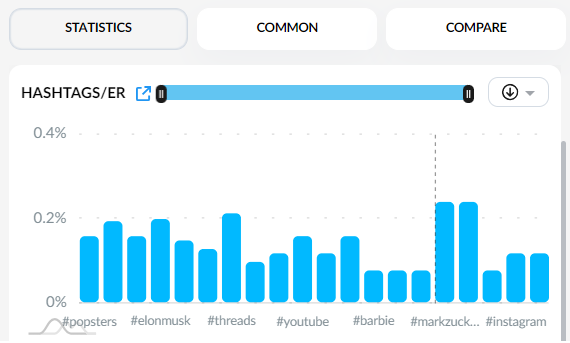
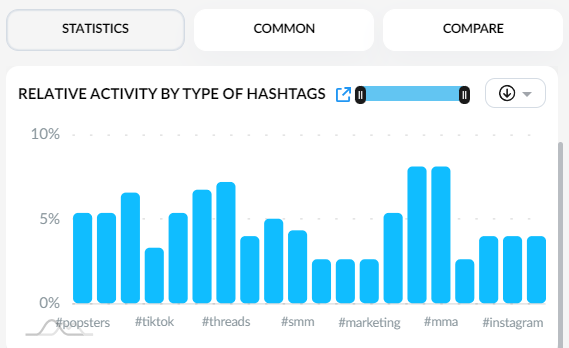
Hashtags, ER and Activity
And more useful metrics for extended analysis of Instagram accounts.
What Influences Instagram Stats?
Performance on Instagram depends on many things: content quality, your account’s subject, content management.
Quality Content
Instagram is a visual social network. Post nice and interesting pictures of the product. Non-unique pictures are not interesting for the audience here, spend resources to creating your own content: photos, videos, gifs, infographics or illustrations.
Audience Relations
Instagram algorithms substantially affect the promotion efficiency in this Social network. Therefore, mind the criteria that influence the feed algorithm. One of important Instagram statistics is engagement. Ask questions to your audience, encourage discussion of materials. Organize more frequent contests and experiment with mechanics: the last comment, tagging a friend, tagging an account in user’s stories have different effects.
Performance Analysis
Efficient performance analysis should be done regularly and not only when problems arise.
Constantly analyze indicators on Instagram and then you will timely adjust the content strategy. Based on statistics, you can understand what subjects are interesting for your audience, what is the best time to post, which format is preferred, how long should descriptions be.
Instagram stats for marketers
Instagram stats 2023 from Hootsuite:
- Instagram is the 8th most visited website in the world;
- Instagram is the 9th most-Googled search term;
- Instagram is the 4th most-used social platform;
- Just 0.1% of Instagram users only use Instagram;
- Instagram is the most-downloaded app in the world;
- Instagram has more than 2 billion active monthly users;
- Instagram’s audience is 52.2% male;
- 61% of 12-to-17-year-olds use Instagram weekly.
Summary: How to Analyze Instagram Statistics
- The two most convenient ways to analyze account statistics are the internal statistics and the Popsters tool.
- The Instagram’s internal statistics is only available to a business profile. It can be enabled by anyone, the setting will take a couple of minutes.
- Instagram account statistics provides: views, reach, likes, comments, saves, profile views, Stories views and scrolling, count of live stream viewers. But it is only available to the account owner.
- Popsters can analyze competitors’ accounts and compare multiple accounts.
- Statistical analysis allows improving content, evaluating advertisement performance, finding competitors’ gimmicks.
Useful articles on a similar topic:
- Statistics and analytics of Twitter accounts: how to get stats of any interesting profile;
- How to Increase reach and engagement on Instagram;
- Top 35 Social Analytics Tools: how to choose the best for you .
Try Popsters Trial plan to get content activity statistics of any pages for a next 7 days for free
Try for free
Popular
-
 Analytics and Statistics for Any YouTube Channel
-
 Analytics and Statistics for Any Telegram Channel or Chat
-
 How to Remove fake Followers on Instagram and Is It Necessary?
-
 Analytics and statistics of Twitter accounts: how to get stats of any profile
-
 How to Increase Telegram Subscribers: Best Free Ways
Try Popsters Trial plan to get content activity statistics of any pages for a next 7 days for free
Try Popsters