-
Common questions
Profiles and authorization
Authorization is done by using a social media profile. To authorize, just press the round button with the logo of the needed network, and then the authorization window will pop up, where you can authorize permission for the tool. After that, the window will automatically close and authorization will be finished. The green circle at the corresponding social media button indicates your authorization status.
If the tool has been previously issued permission, authorization will be complete instantly without any confirmation.
Chrome-based browsers can block the pop-up window during authentication via Twitter: in this case, pop-ups for the Popsters tool must be allowed and the sequence must be repeated (this is done by clicking on the button with red cross icon in the browser's address bar.
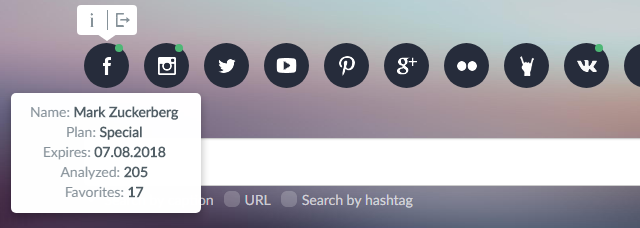
To logout from the tool, you need to hover the pointer over the button of the social network, which is above the address bar. A pop-up form will appear, with two buttons: ‘information’ and ‘logout’. The "logout" button will reset your authorization in the tool.
If you want to log in to the tool as a new user, but upon clicking the button, you authorize as the old one, you must logout first. After that, you should log in to the right social media profile first, and then authorize in the tool. By default, social networks offer you to use an profile, that you have already used, to work on other sites and tools. This may happen when the social network employs an already used account for working on third-party sites and services.
You can see the information about your plan by clicking on the ‘information’ button that appears when you hover over the social network button above the search bar.
In the information panel, you can find the name of the profile, the current plan, the validity period, the number of analyzes carried out and the count of posts in the Favourites.
Pricing
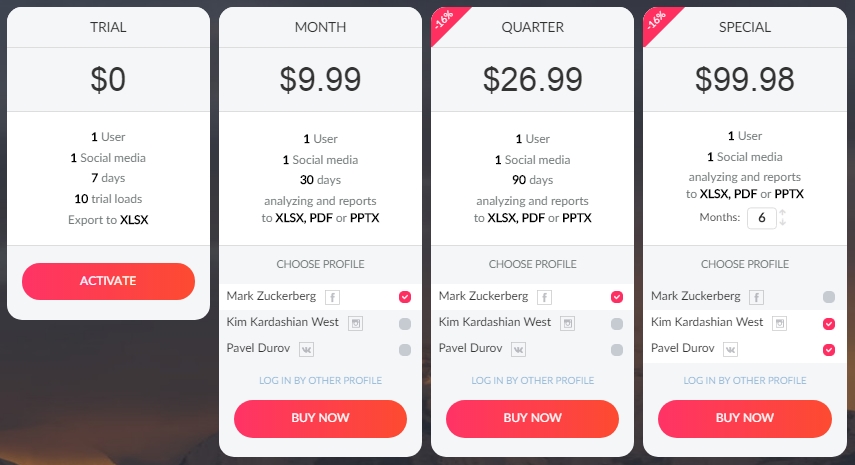
There are three paid full-scale plans and one trial plan, the latter one has some restrictions.
The full-scale plans differ not in functionally, but in the period for which the license is eligible. The Month plan provides access for 30 calendar days. The Quarter plan provides access for 90 days and a discount, which is indicated in the Pricing section.The Special plan is technical as it allows you to manually select and specify any operational period of up to 24 months. With an increase in the number of months paid for, the percentage of the discount is also increased.
Access to the full plans is linked to the social meida profiles that has been ticked. The amount to pay changes depending on the number of added social media’s. The full access for analyzing is provided only for those social networks that have been paid for.
In the same manner, the trial is valid for each profile separately. Therefore, when authorizing and working in several social networks, there are individual limitations for every social network. Manual activation of the trial plan is not required, it occurs automatically when you try to make the first analysis. For example, the user is not given full access if they authorize on Instagram and Facebook for the first time. After the first attempt to analyze something on Instagram, trial plan for this profile is activated, but the Facebook account will remain inactive. If the aforementioned has been done, and you attempted to load data on Facebook (or both networks), the second account will be activated. Calculation of the number of loads (limited trial plan) will be conducted separately, depending on the network subject to analysis.
There is a ‘Choose account’ block In each plan. It displays all the profiles you have activated for the tool. In order to purchase full access to a certain network (or a few of them), you need to tick the necessary account (or the necessary ones if you want to connect full access to different networks) and then proceed to payment. If the required account is not listed, you need to log in to the necessary network on the main page of the tool, then return to the ‘Pricing’ section.
Full access to the tool is not limited in terms of the number of possible analyzes, the number of records stored in the ‘Favorites’ and the number of exported reports.
Full access allows you to analyze any public page on social media’s as well as closed groups (except for private pages on Instagram, where analysis is possible only if you use the tool through this account), if you are a member of such group.
Search and Analysis
After the authorization, the search bar in the center of the screen will become available. To analyze a page or hashtag, you need to find the desired page using the tool and select it for analysis.
Search works in three modes: search by URL (address) of social media page, search by name and search by hashtags.
By default, the search bar works in the URL search mode: to find a page for analysis, you need to insert a link to the page and click the ‘Search’ button. When using for link search, up to 10 communities can be added at once, under condition they are imported from a document / database. Importing multiple communities will work only if their addresses in the source document are split into different lines. I.e. separated by ‘line break’ signs.
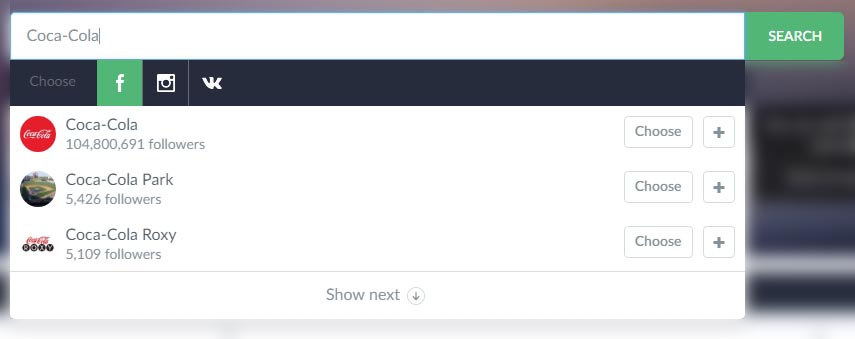
To search by name, you must tick the ‘By name’ mode in the area below the search bar. After that, you need to type the text in and push the ‘Search’ button. As a result, a panel with a list of communities will appear. If you are authorized in several social networks, social network icons will appear above the search results, so you can switch between the search results of these networks. For example, you can add a community from Instagram for analysis, then switch the tab to Facebook and add a few pages from there. In this case, the analysis will be conducted by several social media’s at once.
Hashtag search is available only on some social networks: VK, Twitter, Instagram, YouTube, Coub, Google Plus and Flickr. Additionally, the search for some social media’s can be carried out not only by hashtags, but also by text. Full-function search is possible in all networks except Instagram (i.e. the search in Instagram works only by hashtags).
To search exclusively for hashtags, you must put a # before the keyword. In other cases, the full text will be searched for the word.

The ‘Analyze’ button starts the analysis of the selected pages / hashtags. By default, the analysis is done for the entire lifespan of the page. The calendar icon (next to the ‘Load’ button) allows you to select a specific period, so only the records for that time will be analyzed.
Loaded pages
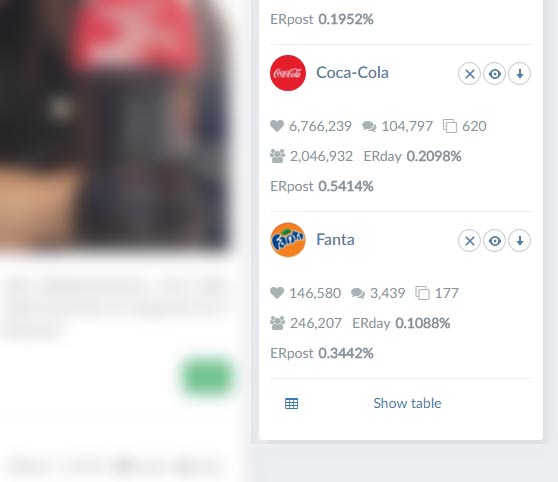
After each analysis, a block for loaded communities appears at the right of the feed, it shows the common stats of the page for the analyzed period. The block reflects total for all main reactions: likes, shares, the count of comments, published posts, views (for YouTube, VK and Coub) and an average ERpost and ERday for all loaded posts.
There are three function buttons next to each page in the block: “Clear” - deletes all analyzed data on this page and clears the memory, “Show/Hide” - shows/ hides the community in the feed and graphs, export - exports all loaded posts on this page to an Excel file (.xls).
With each new analysis performed, the previously loaded communities are automatically hidden from the feed and their totals are reset (since they only display data for posts that are in the feed). When you click the ‘Show’ button for the previously loaded page, all posts appear again in the feed and on the graphs and total metrics are displayed.
Filtering
The tool can be used to filter posts in the feed by types with ability to sort or to add some other filters in the future
When any of the filters are enabled, the total values in the "Loaded pages" block will be automatically recalculated based on the posts that remain in the feed.
Each filter is capable of working in three modes: enabled, disabled and excluded. Disabled filtering works by default and publications are not filtered. Enabled mode leaves only those posts with the content of interest (photo, link, video, etc.). In excluded mode, all posts remain except for the selected format.
Different filters can be combined with each other. For example, photos of interest can be filtered for, but text will be excluded. In this case, only posts consisting of images without text will remain in the feed.
Corporate profiles
Corporate profiles provide multiple users access to the tool. It is suitable for advertising agencies and companies that require work of several employees on same social networks at the same time.
Access is provided to a certain e-mail profile with ability to specify the number of social media’s needed for the work, the period of purchase, and the number of users for each social media. After payment, the plan is assigned to the e-mail address, and the owner is able to distribute paid access slots to the necessary profiles of employees in the corresponding social media’s.
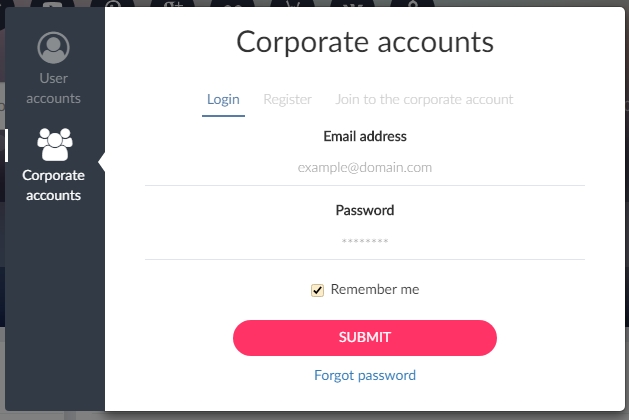
To register an account, you must open the account management window must (the button appears at the right after authorization in the tool on any social media) and choose ‘Corporate profiles’ section. In the “Registration” tab you must type the e-mail and password. After that, a mail with a confirmation link will be delivered via email. Authorization will be available only after confirming the e-mail address.
Corporate plans are available in a special section of the ‘Pricing’ page. There is a link at the right (or bottom, depending on the width of the screen) of the main Pricing plans section. On the page, you can mark the needed social networks, specify the number of months and the number of users for each social media. Discounts are calculated in the same way as the personal plans, but with additional deductions: the discount increases when the access is acquired for a larger number of users and social media’s.
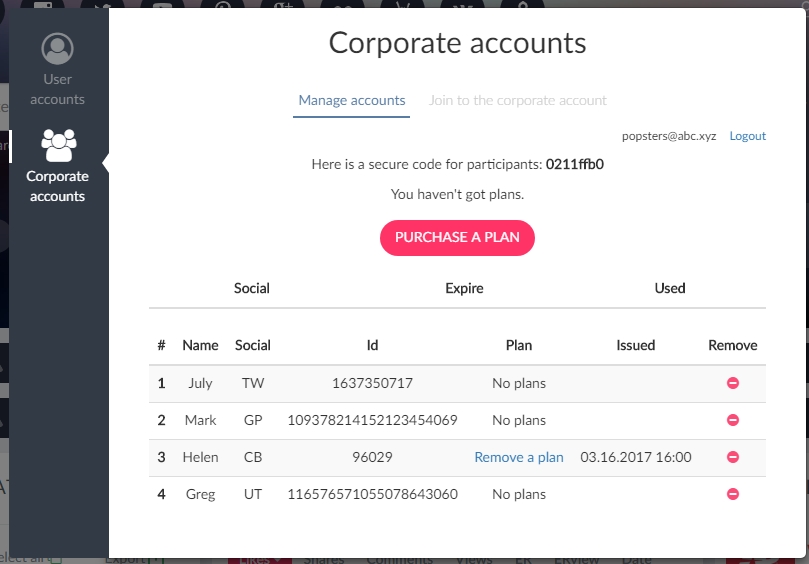
After obtaining accesses, data on the access slots acquired to each social network will appear in the corporate profile management page. The accounts that are attached to the corporate profile are displayed at the bottom of the window. Initially, this block is empty and the specified social media users must be added.
To add a profile of a social media user to a corporate account, the owner (manager) of the corporate profile must to give the email address and a special secure code to the employee. The code is given in the special window in the 'Join a corporate account' section.
You can tie the corresponding slot to the linked user profile by clicking the "Connect Plan" button. Having done so, the user can use the tool without restrictions from the corresponding profile. The owner of a corporate account can either grant access to a profile, or disable this access and transfer it to another profile. Attention: you can transfer access rights from one profile to another within the same paid slot only once every 2 weeks.
If you have a user profile on a social network with paid access rights, the corporate slot will replace the active plan. Deleting the user from a corporate slot returns the user the previous plan. The duration of the corporate and basic plans is not combined. When returning to the basic plan, the expiration date is set according to the latest purchased plan.
-
Using metrics
ER (engagement rate)

Engagement Rate is a metric that shows how much followers were engaged to the published posts. In other words, it displays the percentage of followers who have been active in publications.
The tool calculates six types of ER: ERpost is the user engagement rate for a particular post, ERday is the user engagement rate for all published posts per day, ERview is the engagement rate for a particular post in terms of the number of views (for VK, YouTube, Coub and Flickr). Average ERpost is the average of ERpost for all posts for the analyzed period. Average ERview is the average of the ERview for all posts, Average ERday is the average of ERday for all posts for analyzed period.
ER is calculated using the following formulas:
ERpost = (likes+shares+comments[+dislikes for YouTube])/count of followers
ERview = (likes+shares+comments[+dislikes for YouTube])/count of views
ERday= (total likes + total shares + total comments for the day[+total dislikes for YouTube])/count of followers
Average ERpost = (total likes for analyzed period + total shares for analyzed period + total comments for analyzed period[+total dislikes for analyzed period for YouTube])/count of followers/count of posts for analyzed period
Average ERview = (total ERview of all posts for analyzed period)/count of posts for analyzed period
Average ERday = (total likes for analyzed period + total shares for analyzed period + total comments for analyzed period[+total dislikes for analyzed period for YouTube])/count of followers/number of days in analyzed period
In general, ERpost allows you to measure the efficiency of posts and shows how interesting they are to your followers. ERday only shows engagement on a daily basis and it should be treated more like ‘effective reach’ stat as it displays the percentage of the audience engaged on a particular day. The tool shows ER in several different places. Average values for ERpost and ERday are given in the loaded pages block and in the comparison table. ERpost for a particular post is given in the information about this publication. Daily graphs show ERday for each period. There is also average ERpost for a particular type of post on stats for this type of post.
Calculating ERday, the days are counted based on of the first and last post in the period. This is done so the data reflect actual development: for example, if a community has been posting only in the last month of its 3-year existence, the data will be used only for this last month.
The ER indicators in the loaded pages block recalculate when any filtering is turned on, displaying the average ER only for those posts that remained in the feed.
LR (Love Rate)
Love Rate is a metric of attractiveness of posts. It is similar to ER, but it takes only the count of likes. It allows you to evaluate whether posts are attractive to the audience
LR is calculated by the formula:
LR = (total likes)/followers/count of posts for the analyzed period
The tool calculates LR for each analyzed page and is located in the summary table (the 'Show table' button under the loaded pages block )
TR (Talk Rate)
Talk Rate is the metric of sociability. It is a metric similar to ER, but it takes into only the count of comments. It will help assess how much the audience is involved in communication
TR is calculated by the formula:
TR = (total comments)/followers/count of posts for the analyzed period
The tool calculates TR for each analyzed page and is located in the summary table (the ‘Show table’ button under the loaded pages block ). Both the LR and TR indicators will help evaluate and measure some activity when planning the community’s strategy.
Total values
With each performed analysis, the tool automatically summarizes all the indicators:
The total count of likes, shares, comments, views and dislikes from all analyzed posts.
The data is displayed in the loaded pages block and in the comparison table
Chrome-based extension Popsters for Instagram analyzing
Extension adds new features for analyzing Instagram profiles. It allows to collect and analyze posts data for pages that are not business profiles or are private. Also, it helps to collect public data for business profiles with ads. To use you need just to install an extension to the Chrome-based browser and put the link of the needed page to the tool. Such analysis takes much more time, therefore the search and collecting data will take some time.
For analysis of business-profiles to get public data you need to decline Facebook-auth after basic Instagram authorization.
Chrome-based extension Popsters for TikTok analyzing
Extension adds new features for analyzing TikTok pages. Due TikTok has not published yet public API, analysis without extensions is unavailable.
-
Charts
Days of week
The chart shows the relative activity of an average post that have been published on a particular day of the week. This chart doesn’t display the count of published posts by days of the week. In reality, it shows the average activity of posts that were published on different days of the week, comparing to the post made on other days. Data is given in percent (%) using information for the whole analyzed period.
To calculate the relative activity by the days of the week, the tool takes into all posts published on a particular day of the week, sums up all the activities for each day, then calculates the average count of engagement on these days and calculates their relative percentage.
For example If Mondays index is 15%, and for Wednesday it is 10%, an average post appearing on Monday was 1.5 times more popular than one published on Wednesday.
This index can be used for planning the best day for publishing of your posts / advertisements.
Time of day
The chart shows the relative activity of the average post published in a particular moment. This chart doesn’t display the number of published posts by time, but shows instead the average activity of posts that are issued at different hours of the day, comparing to posts that were released at another time.
Data is calculated in percent (%) based on all information for the analyzed period.
To calculate the relative activity by time of day, the tool takes into all posts that have been published at particular time, sums up all the activities for each hour, calculates the average number of engagements at that time and calculates their relative percent.
For example If the index is 3,5% at 4 pm, and it is 7% at 9 pm, an average posts at 9 pm is more than 2 times more popular than one published at 4 pm.
This index can be used for planning the best time for publishing of your posts / advertisements.
ERpost by days of week/Text length
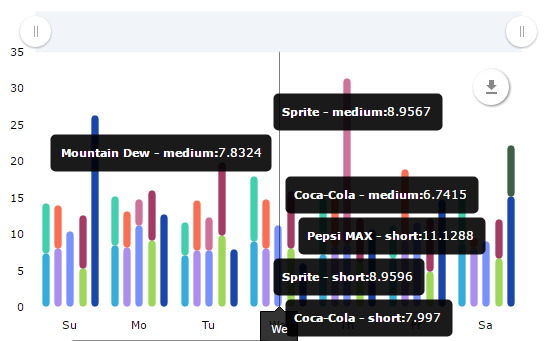
The behavior of the audience at different hours of the day and the days of the week differs: for example, a student on weekdays can be busy studying and will not be able to read a long text, but he may be interested in short posts, and on weekends an opposite situation may be observed.
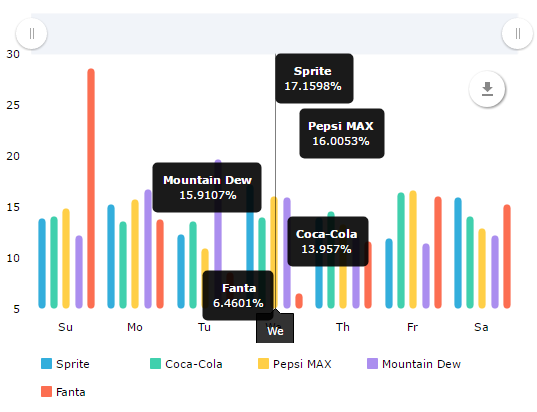
This chart displays the average ERpost for posts that have been published with text of a particular length on different days of the week.
To calculate such data, Popsters categorizes all posts into three types: posts with short text (up to 160 symbols), posts with medium-size texts (from 160 to 1000 symbols), posts with long text (from 1000 symbols). Next, the tool calculates the average ERpost of all posts published on a given day of the week.
Each values column can consist of three segments, corresponding to three types of text length.
The chart will help to determine what format of publication on average has gained the most activity in these days of the week.
ERpost by time of day/Text length
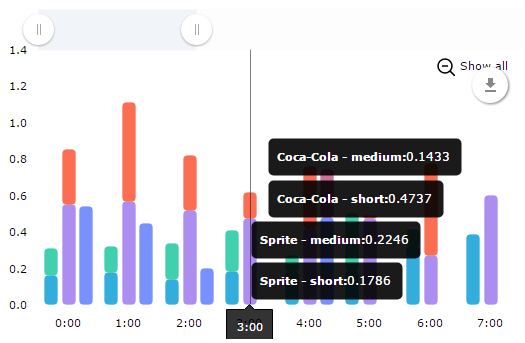
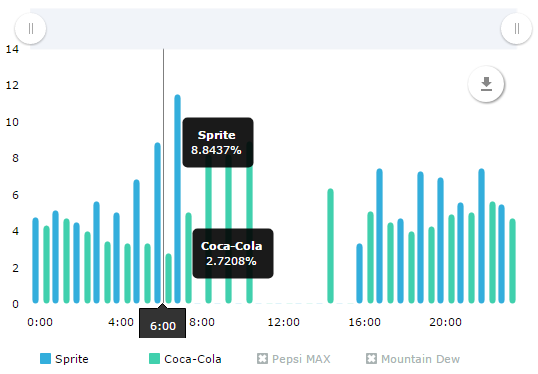
This chart displays the average ERpost for posts that have been published with a text of a particular length at different times of the day.
To calculate such data, Popsters categorized all posts into three types: posts with short text (up to 160 symbols), posts with medium-size texts (from 160 to 1000 symbols), posts with long text (from 1000 symbols). Next, the tool calculates the average ERpost of all posts published on a given day of the week.
Each values column can consist of three segments, corresponding to three types of text length.
The chart will help to determine what format of the posts on average was the most popular at different times of the day.
Relative activity by days of week/Text length
The chart is similar to ‘Days of week / volume of text’, but percentage to other formats on other days of the week is used instead of ERpost stats.
It will be useful in cases when ERpost differs for multiple communities when comparing several pages. It is also applicable when searching and analyzing hashtags from social networks (search for all the hashtags in the networks of interest).
Relative activity by time of day/Time length
The chart is similar to ‘Times of week / volume of text’, but percentage to other formats on other days of the week is used instead of ERpost values.
It will be useful in cases when ERpost differs for multiple communities when comparing several pages. It is also applicable when searching and analyzing hashtags from social media’s (search for all the hashtags in the social media of interest).
Likes
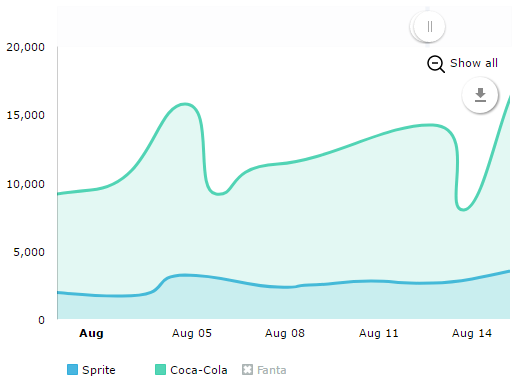
The chart displays the total count of ‘likes’ for all posts publushed on each day in the analyzed period.
The chart can be scaled, it can also be filtered by any value (by clicking on a point on any day): in this case, only the posts for that day will remain in the feed.
When counting ‘likes’, all reactions of the audience in the social network Facebook are considered.
It is useful when the total ‘like’ statistics for a community must be evaluated.
Shares
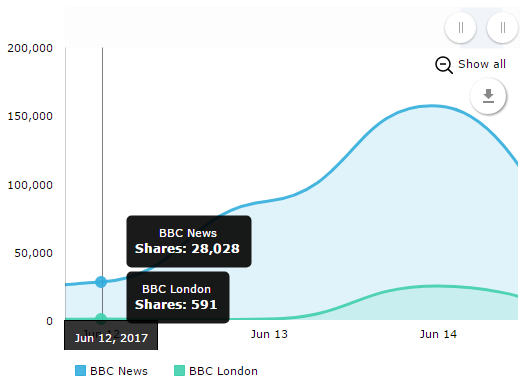
The chart displays the total count of ‘shares’ for all posts published on each day in the analyzed period.
The chart can be scaled, it can also be filtered by any value (by clicking on a point on any date), in this case, only the posts for that day will remain in the feed.
This chart appears only for those social media’s where it is possible to share a post in the user’s feed (not available, for example, for Instagram and YouTube).
It is useful in cases when you want to evaluate the general statistics of the page for reposts in the analyzed period.
Comments
The chart displays the total count of comments for all posts published for each day in the analyzed period.
The chart can be scaled, it can also be filtered by any value (by clicking on a point on any date), in this case, only the posts for that day will remain in the feed.
Comments are counted only for those social media’s where commenting is possible (comments are disabled on Coub and unavailable for counting on Twitter).
It is useful when you need to measure the total statistics of comments in a page for the analyzed period.
Views
The chart shows the total count of views for all video posts (and photos on Flickr) that appeared on each day in the analyzed period.
The chart can be scaled, it can also be filtered by any value (by clicking on a point on any date), in this case, only the posts for that day will remain in the feed.
Views are only given for those social media’s where they are counted: Coub, YouTube, VK and Flickr.
It is useful when you need to evaluate the total statistics of views in a community for a certain period.
ER
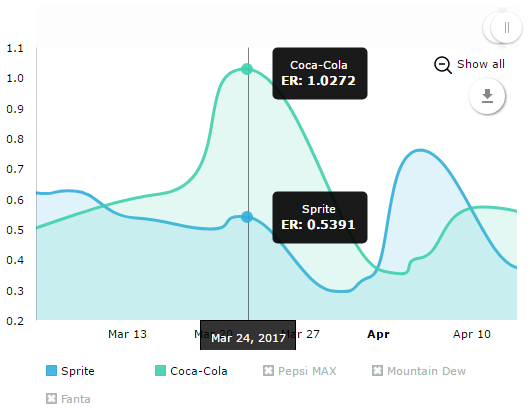
The chart displays the total ER (ERday for each date) for all posts published on each day in the analyzed period.
The chart can be scaled, it can also be filtered by any value (by clicking on a point on any date), in this case, only the posts for that day will remain in the feed.
When counting ‘likes’, all reactions of the audience in the Facebook are considered.
It is useful when you need to evaluate the size of engagement audience for each date in analyzed period.
Posts
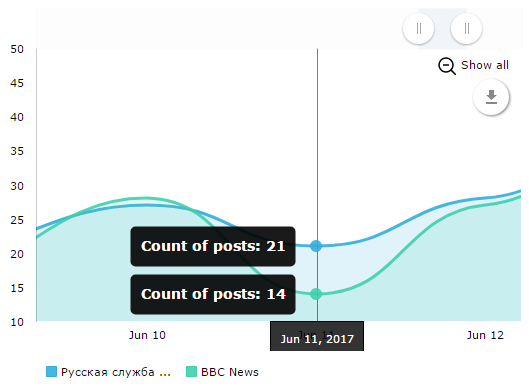
The chart shows the number of posts published on each date in the analyzed period.
The chart can be scaled, it can also be filtered by any value (by clicking on a point on any date), in this case, only the posts for that day will remain in the feed.
It is useful when you need to evaluate the count of posts in a page for a analyzed period.
Posts by text length
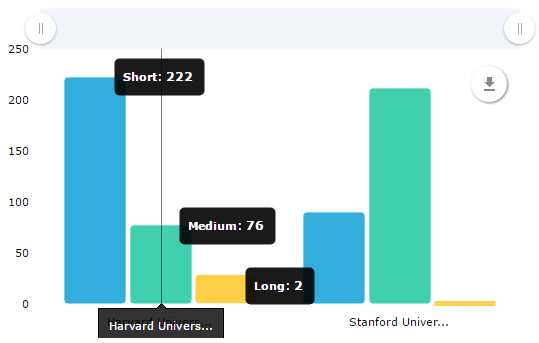
Displays the total number of posts with texts of a certain length that have been published in the analyzed period.
To calculate such data, Popsters categorizes all posts into three types: posts with short text (up to 160 symbols), posts with medium-size texts (from 160 to 1000 symbols), posts with long text (from 1000 symbols).
ERpost by text length
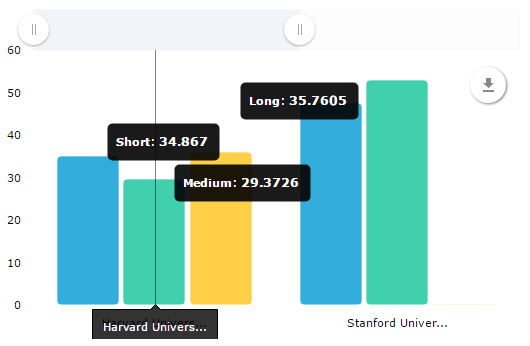
Demonstrates the average ER (engagement) in posts with text of a particular length in general.
To calculate such data, Popsters categorizes all posts into three types: posts with short text (up to 160 symbols), posts with medium-size texts (from 160 to 1000 symbols), posts with long text (from 1000 symbols). Next, the tool calculates ERpost for every post and gives the average ERpost for them.
It is useful to undersatnd the most popular format of posts.
Posts by type of content
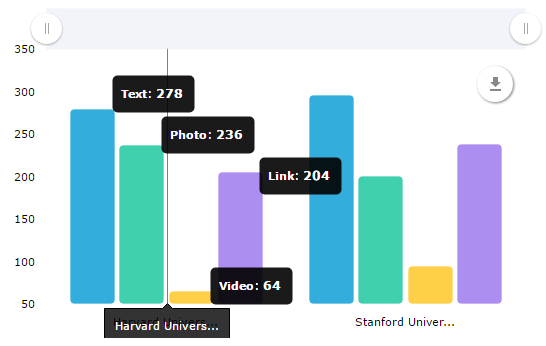
Displays the total number of posts with a particular type of content. Different types of attachments (photo and video, for example) in one post are considered here as different units.
It shows the total number of posts with videos, images, links or text.
It allows you to calculate count of published records for different types of content.
ERpost by type of content
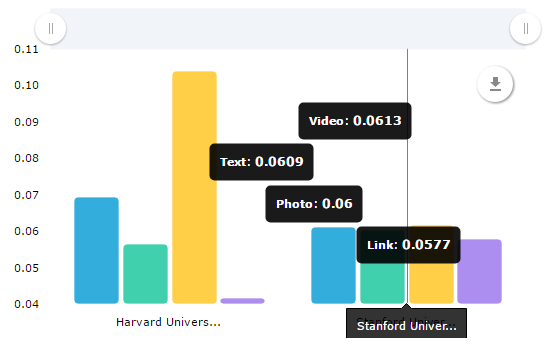
It demonstrates the average ER (engagement) in posts with a particular type of content. It helps to understand the kind of posts that are more attractive for the audience.
Relative activity by type of content
The chart is similar to ‘ER by content type’ but the percentage of activity to other posts is shown instead of ERpost indexes.
It is useful if ERpost for multiple pages is radically different. It can also be used for searching and analyzing hashtags or searching all instances when a particular hashtag was used.
Hastags
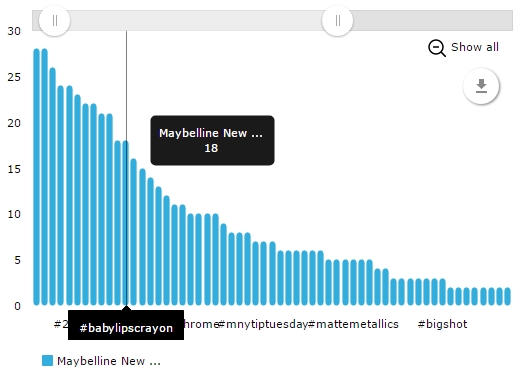
It demonstrates the count of posts with a particular hashtag for all analyzed posts.
It will help calculate the statistics of using certain hashtags in posts.
Hastags/ER
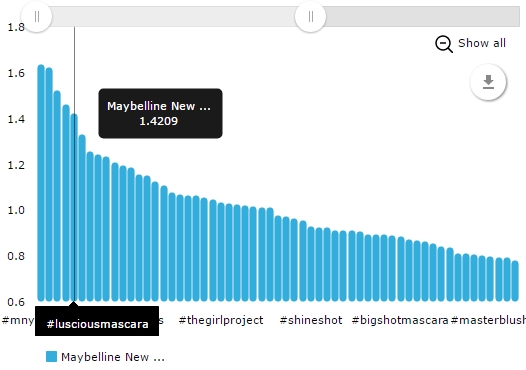
It shows the average ERpost of all posts with a particular hashtag.
It will help to evaluate the activity of posts in response to a particular hashtag. It is useful for calculating the efficient of the ad tags, chosen categories or competitive analysis.
Relative activity by hashtags
Shows the activity of an average publication with a particular hashtag in relation to posts with other hashtags.
It is useful if ERpost for multiple communities is radically different. It can also be used for searching and analyzing hashtags or searching all instances when a particular hashtag was used.
Words (text analyzing)
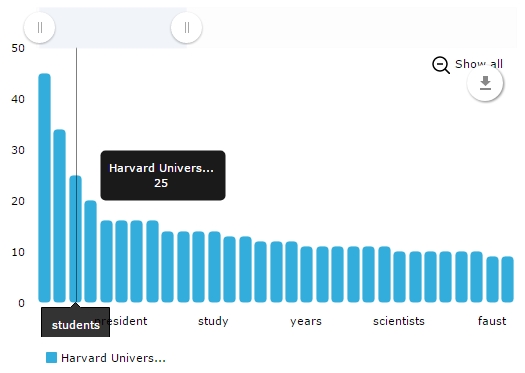
Shows the number of posts that use certain words.
The tool looks through the text of each publication and counts the most commonly used words.
It will help you to learn the vocabulary used, its frequency, and it also determines the topics used in the content if hashtag are not used to tag the posts.
Words/ER (text analyzing)
Shows the average ERpost of posts containing a particular word.
The tool calculates the average efficiency (by ERpost) of posts where a particular word was used.
It help assess the impact of using different topics on the popularity of posts
Popular
FEATURES
- Sorting and filtering of posts
- Synchronous analyzing different social media pages
- Exporting to XLSX, PPTX, PDF
- Measuring efficiency of different types of posts
- Analyzing of posts with different hashtags and words
- Statistics of activity in graphs and charts of data
Popsters
- Social Media Content
- Analysis Tool - popsters.com
- Facebook community - https://www.fb.com/popstersanalytics
- Support - support@popsters.com
- Popsters Terms
- Privacy Policy
TELL ABOUT US
2013-2022 © POPSTERS.
All rights reserved